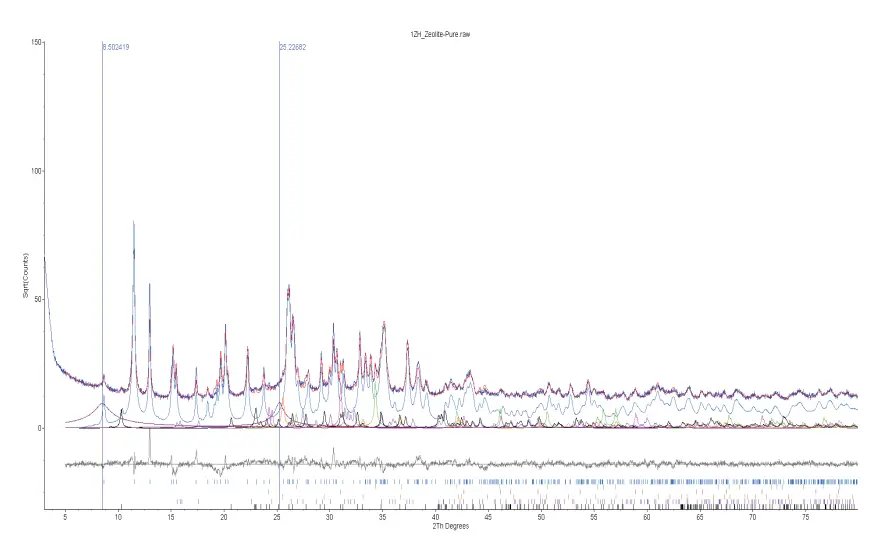
Figure 1. Rietveld refinement plot of sample ZEO Health Inc- Zeolite-Pure (blue line – observed intensity at each step; red line – calculated pattern; solid grey line below – difference between observed and calculated intensities; vertical bars – positions of all Bragg reflections). Coloured lines are individual diffraction patterns of all phases.